Big Data Log Management with Anexia Engine
Centralized log management is essential for monitoring and analysis of larger IT infrastructures, in order to detect problems as early as possible and, in the worst case, keep downtimes as short as possible.
Anexia monitors thousands of network components, servers, and applications around the world and around the clock for its customers. This is not only a matter of metrics and availability, but also about detecting security gaps and attacks. These requirements have led, among other things, to the development of the Anexia Engine CloudLog module. CloudLog is a cloud service that stores and analyzes masses of log data and metrics from a wide range of systems.
CloudLog supports a variety of data sources
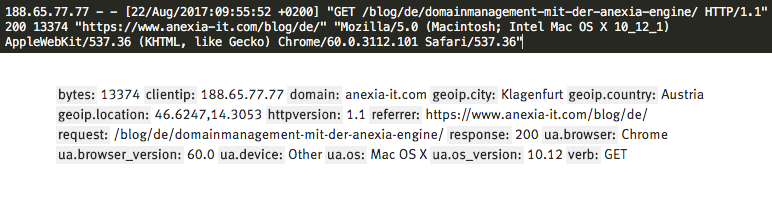
Any device that exports log data can also be connected to CloudLog. The service offers a variety of standardized interfaces and also supports the integration of in-house protocols. The format in which the messages are transmitted is not important. Dynamic data models allow users to define how the messages must be handled and itemized. Additional information such as GeoIP data can also be added.
Visualization tool for graphical editing
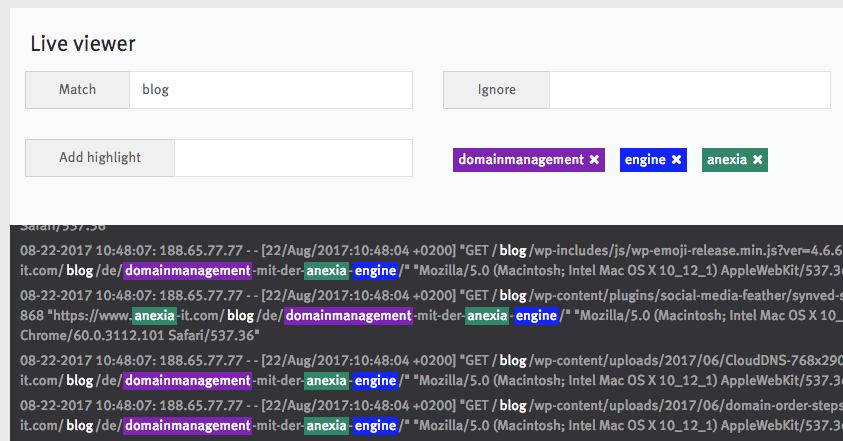
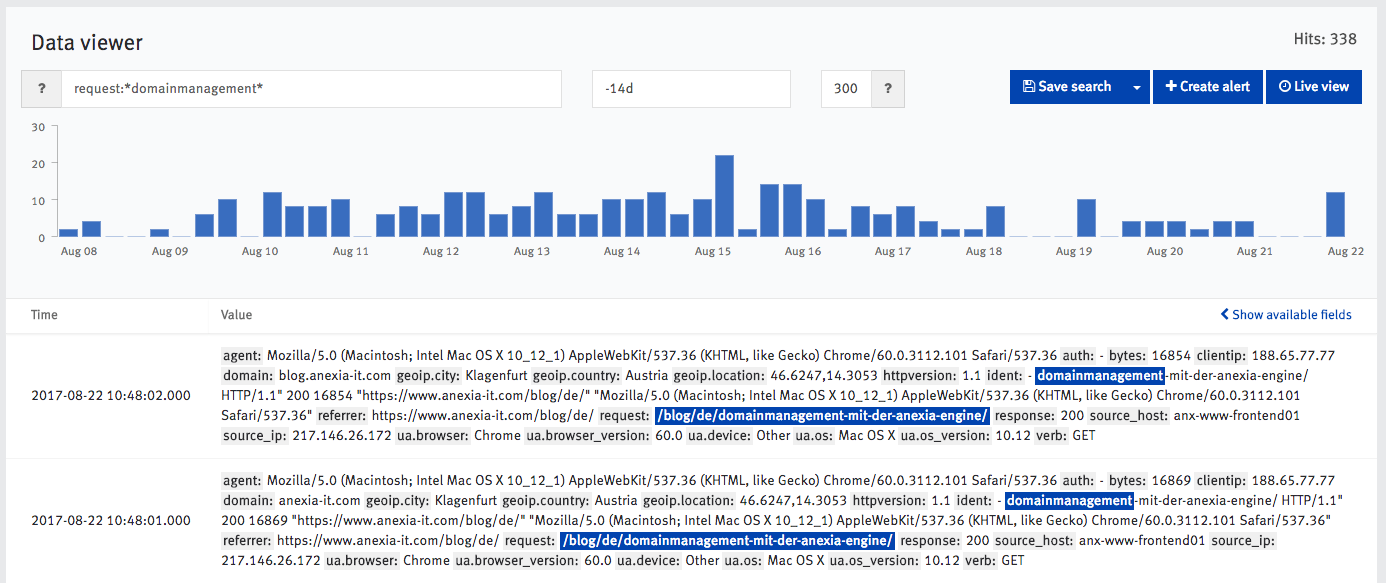
Users can track and filter data in real-time during delivery. For a typical troubleshooting scenario, there is a live view of the current data stream. Historical and indexed data can later be searched through using even more complex queries. Users can store frequently used searches or transfer them to an alert.
This is what the live viewer looks like:
And this is what the data viewer looks like:
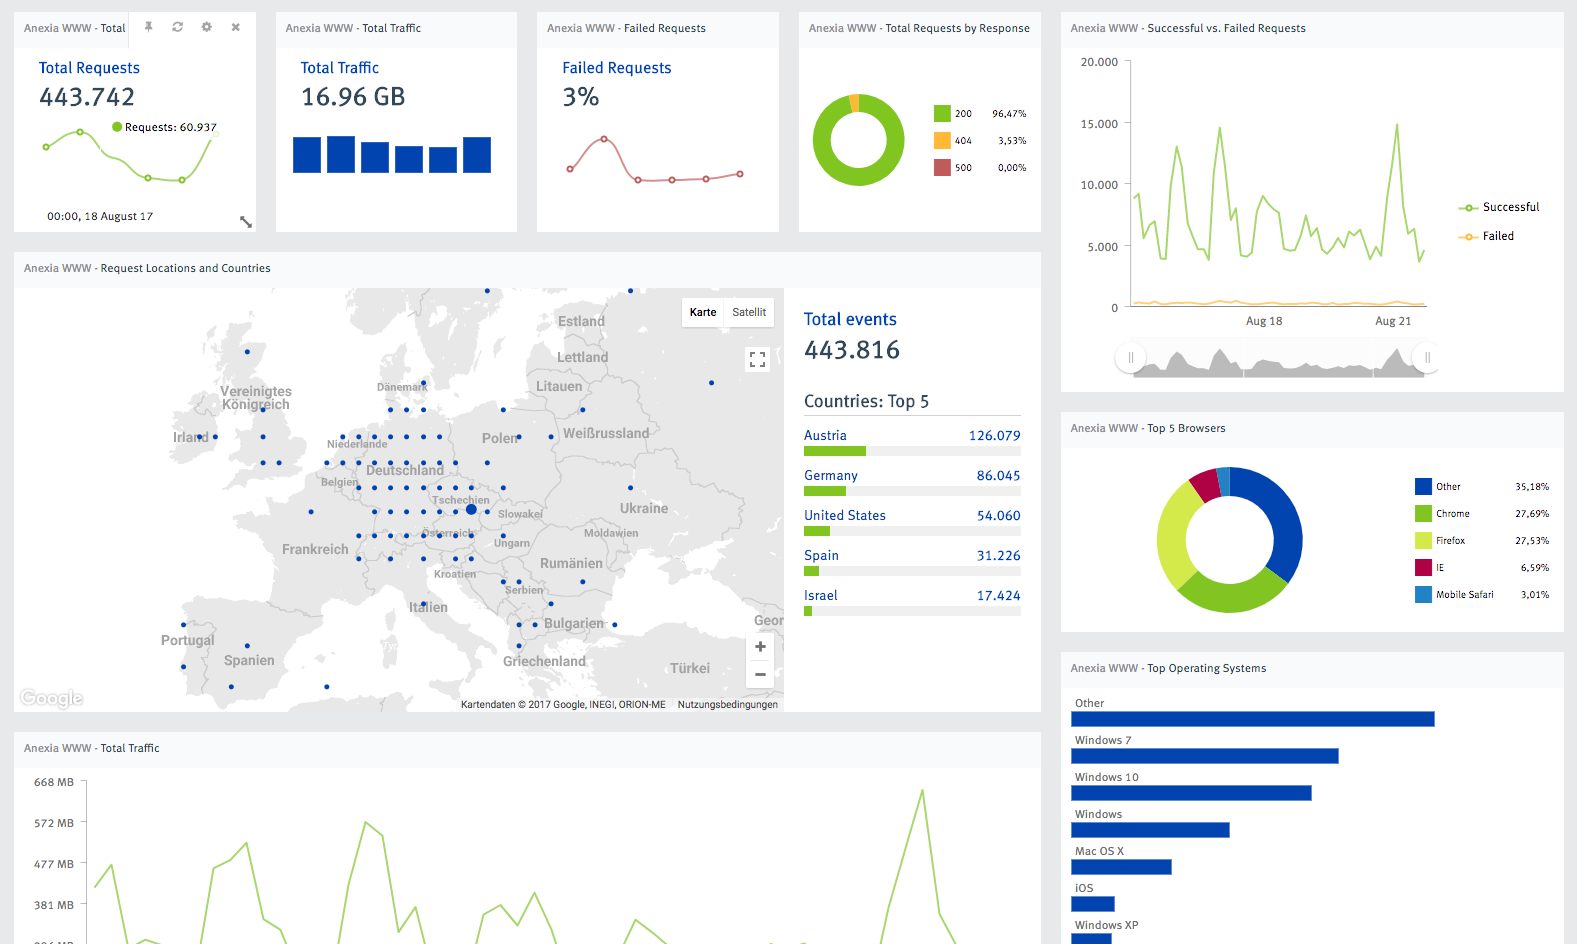
Within the Anexia Engine, an in-house visualization tool can display the CloudLog data graphically. Users can choose either chart and dashboard templates for predefined topics and applications or even define their own visualizations. Users can filter individual charts as well as the entire dashboard. It is even possible to visualize a combination of several data sources. Dashboards can also be shared in read mode, which is very useful for monitoring screens, for example. It is also possible to generate onetime or periodic PDF reports from the dashboards.
Here is an example of a dashboard:
Alert function for emergencies
One of the most important and useful features in CloudLog is the alert function. It allows users to define notifications for specific events via a wide range of channels. In addition to simple threshold values (CPU load, traffic, number of queries, etc.), this also includes complex conditions for detecting an incident. For example, in Windows Event Log, the system can automatically detect the execution of Ransomware, such as WannaCry, and prevent the worst from happening. Notification can be sent via e-mail, SMS and WebHook as well as to third-party provider systems, allowing initiation of automated countermeasures.
Technical information
CloudLog is horizontally scalable and provides industry standard and standardized interfaces such as syslog, HTTP, e-mail, simple TCP/UDP streams and Kafka. This also allows data sources to be connected to existing services such as Rsyslog, Logstash/Beats, Fluentd or Flume. A separate security layer compatible with the Elasticsearch API forms the CloudLog Query API to the outside, allowing users to connect their own applications as well as external visualization and analysis tools such as Kibana or Grafana. As a result, there are no restrictions in the further processing of data and even the whole scope of raw data can be exported again if needed.
Conclusion
The monitoring of IT infrastructures, network components, servers, and applications results in masses of data. Central log management is crucial for the early detection of problems, security gaps or attacks and any associated downtime. The Anexia CloudLog module systematically analyzes the resulting data and prepares it graphically in order to inform users as well as possible of any abnormalities. We have carried out various application scenarios with the first customers and upgraded our module to corresponding scenarios. As a result, CloudLog has become a powerful tool that can be customized to suit both large and small projects. For what sort of cases are you still looking for a big data tool? Please let us know: info@anexia-engine.com